Trace-based Testing the OpenTelemetry Demo
With contributions from Adnan Rahić and Ken Hamric.
The OpenTelemetry Demo is a system that simulates a Telescope Shop, consisting of multiple microservices written in different languages, each handling a specific capability of this distributed system. Its purpose is to demonstrate how OpenTelemetry tools and SDKs can be used in an application to obtain telemetry for monitoring results and even to track problems across multiple services.
One challenge when maintaining the demo is to add new features to the ecosystem and guarantee that the current features and telemetry work as intended. Thinking about this issue a few months ago, the OpenTelemetry Demo team started a discussion to prevent future system changes from having unwanted outcomes to the microservices results and its telemetry. This resulted in adding trace-based tests to the demo.
This article describes how trace-based tests were added to the OpenTelemetry Demo. It discusses the challenges we faced while building it, the outcomes, and how it can help the OpenTelemetry community test the demo and add features with greater confidence.
What is a trace-based test?
Trace-based testing is a type of testing that validates a system’s behavior by triggering an operation against the system and validating its result by checking the system output with the emitted traces generated by the system during this call.
This term was popularized by Ted Young in the talk Trace Driven Development: Unifying Testing and Observability at KubeCon North America 2018.
To perform a trace-based test, we execute an operation against the system, which generates a trace, following these steps:
- Trigger an operation against the system and collect its output and trace ID generated from the operation.
- Wait for the system to report the entire trace to the telemetry data store;
- Collect the trace data generated by the system during the operation. This data should include timing information, as well as any errors or exceptions encountered.
- Validate the operation output and the trace data by checking it against the expected results. This involves analyzing the trace data to ensure the system behaved as expected and the output was correct.
- If the trace data does not match the expected results, the test should fail. With the trace data in hand, the developer can investigate the issue and make necessary changes to the system or the test.
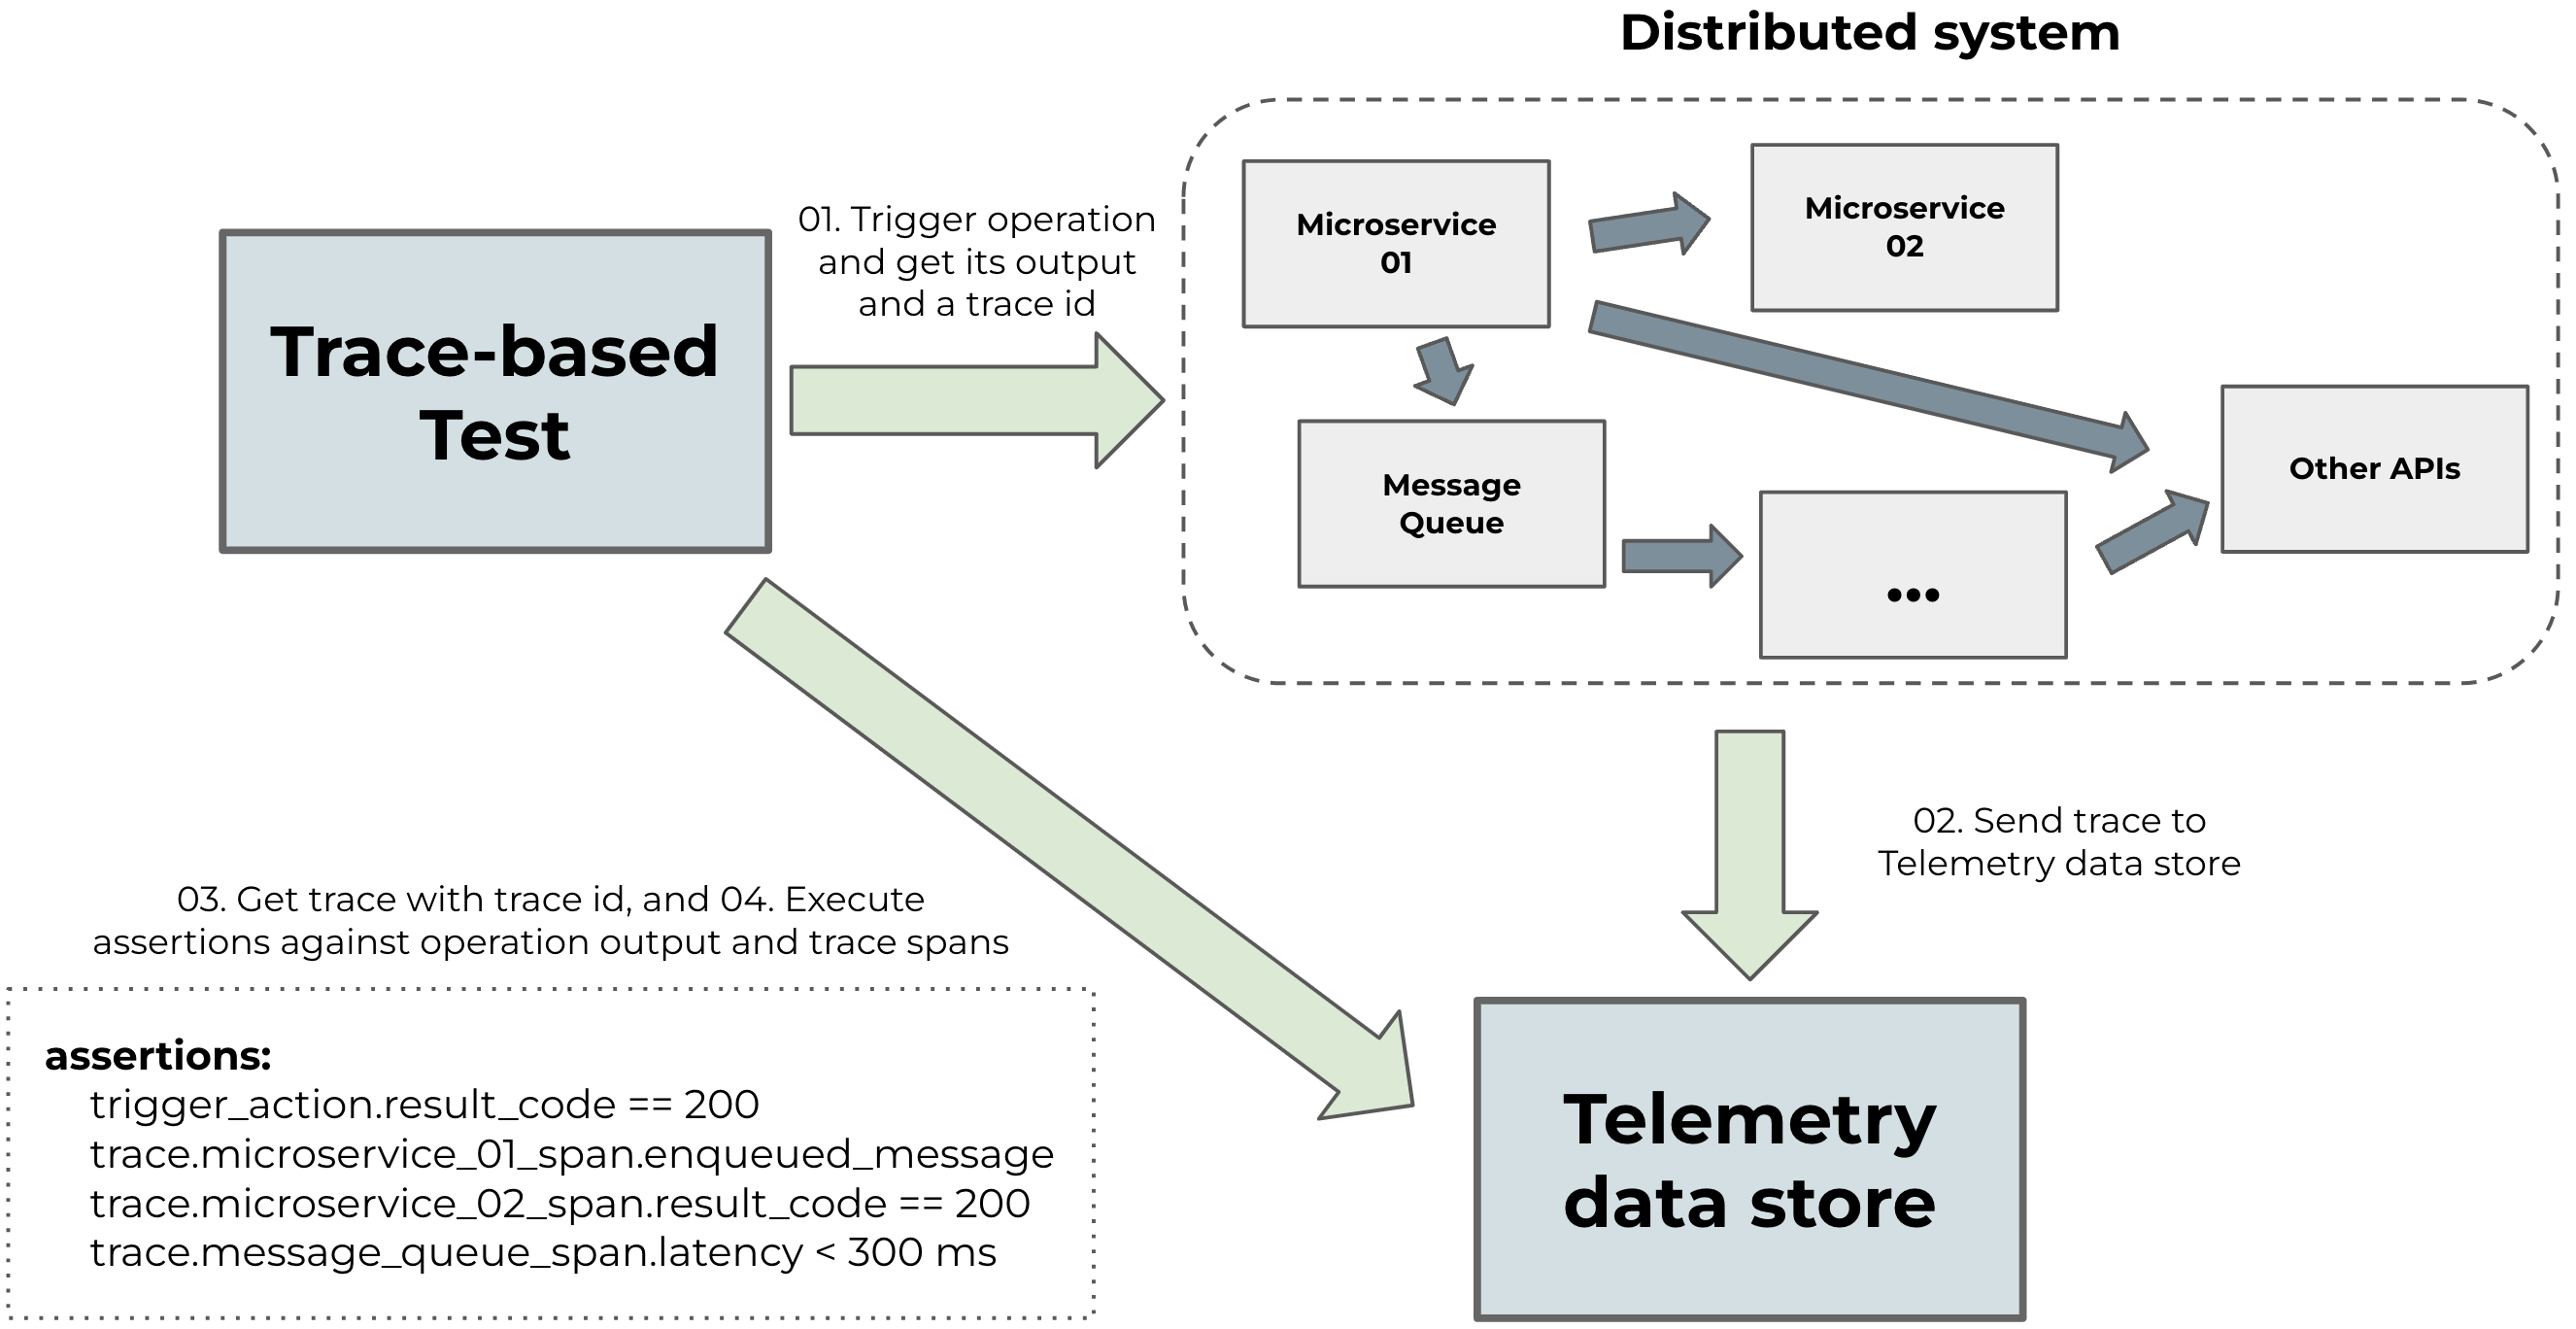
These types of tests allow the testing of multiple components in distributed systems simultaneously, ensuring that they work together correctly. It also provides a way to test the system’s behavior in response to real-world conditions, such as failures or slow response times from external services.
Creating trace-based tests for the OpenTelemetry Demo
In the OpenTelemetry Demo, we included trace-based tests to verify that system changes do not result in unwanted outcomes in both the results and telemetry. Our testing mainly focused on the services involved in the main workflow of the system, which includes:
- A user navigating to the shop
- Selecting a product
- Deciding to make a purchase
- Completing the checkout process
We structured two types of tests based on tests that currently exist in the demo:
- Integration tests
- End-to-end tests
The tests are organized into 26 trace-based tests for 10 services, which can be
found
here.
These trace-based tests in the tracetesting directory are ported from AVA and
Cypress and test both the operation outcome and the traces.
Integration tests
The integration tests are based on AVA tests. In these tests, we trigger endpoints in each microservice in the system, validate their responses, and ensure that the resulting observability trace matches the expected behavior.
One example is an integration test made against the currency service to check if the currency conversion operation is returning correctly. Here’s a simplified YAML definition of the trace-based test:
type: Test
spec:
  name: 'Currency: Convert'
  description: Convert a currency
  trigger:
    type: grpc
    grpc:
      protobufFile: { { protobuf file with CurrencyService definition } }
      address: { { currency service address } }
      method: oteldemo.CurrencyService.Convert
      request: |-
        {
          "from": {
            "currencyCode": "USD",
            "units": 330,
            "nanos": 750000000
          },
          "toCode": "CAD"
        }
  specs:
    - name: It converts from USD to CAD
      selector:
        span[name="CurrencyService/Convert" rpc.system="grpc"
        rpc.method="Convert" rpc.service="CurrencyService"]
      assertions:
        - attr:app.currency.conversion.from = "USD"
        - attr:app.currency.conversion.to = "CAD"
    - name: It has more nanos than expected
      selector: span[name="Test trigger"]
      assertions:
        - attr:response.body | json_path '$.nanos' >= 599380800
In the trigger section, we define which operation to trigger. In this case, a
call to the gRPC service with the method oteldemo.CurrencyService.Convert and
a given payload.
After that, in the specs section, we define which assertions to make against
the trace and the operation result.
We can see two types of assertions:
- The first assertion is against a trace
span that the
CurrencyServiceemitted. It checks if the service received a conversion operation from USD to CAD by checking if the span attributesapp.currency.conversion.fromandapp.currency.conversion.tohave correct values; - The second assertion is made on a trace span representing the operation
output, where we check if the response body has an attribute
nanoswith a value less or equal to599380800.
End-to-end tests
The end-to-end tests are based on front-end tests using Cypress. We call the services through the API used by the front end and check if the service interaction between them is correct. We also verify if a trace is propagated correctly through the services.
For these tests, we considered a scenario based on the main use case of the demo: “a user buying a product” executed against the Front-end service APIs that execute the following operations:
- While entering the shop, the user sees:
- Ads of shop products.
- Recommendations of products suitable for them.
- The user opts to browse a product.
- Adds it to the shopping cart.
- Checks the cart to see if everything is correct.
- Finally complete the order, by using the checkout feature of the shopping cart, which will place an order, charge the user’s credit card, ship the products and clean the shopping cart.
Since this test is a sequence of smaller tests, we created a transaction that defines the tests that will be run:
type: Transaction
spec:
  name: 'Frontend Service'
  description:
    Run all Frontend tests enabled in sequence, simulating a process of a user
    purchasing products on the Astronomy store
  steps:
    - ./01-see-ads.yaml
    - ./02-get-product-recommendation.yaml
    - ./03-browse-product.yaml
    - ./04-add-product-to-cart.yaml
    - ./05-view-cart.yaml
    - ./06-checking-out-cart.yaml
In this sequence of tests, the last step, where the user does a checkout, is interesting because it triggers due to the operation complexity. It coordinates and triggers calls in almost all system services, as we can see in this Jaeger screenshot of a trace for this operation:
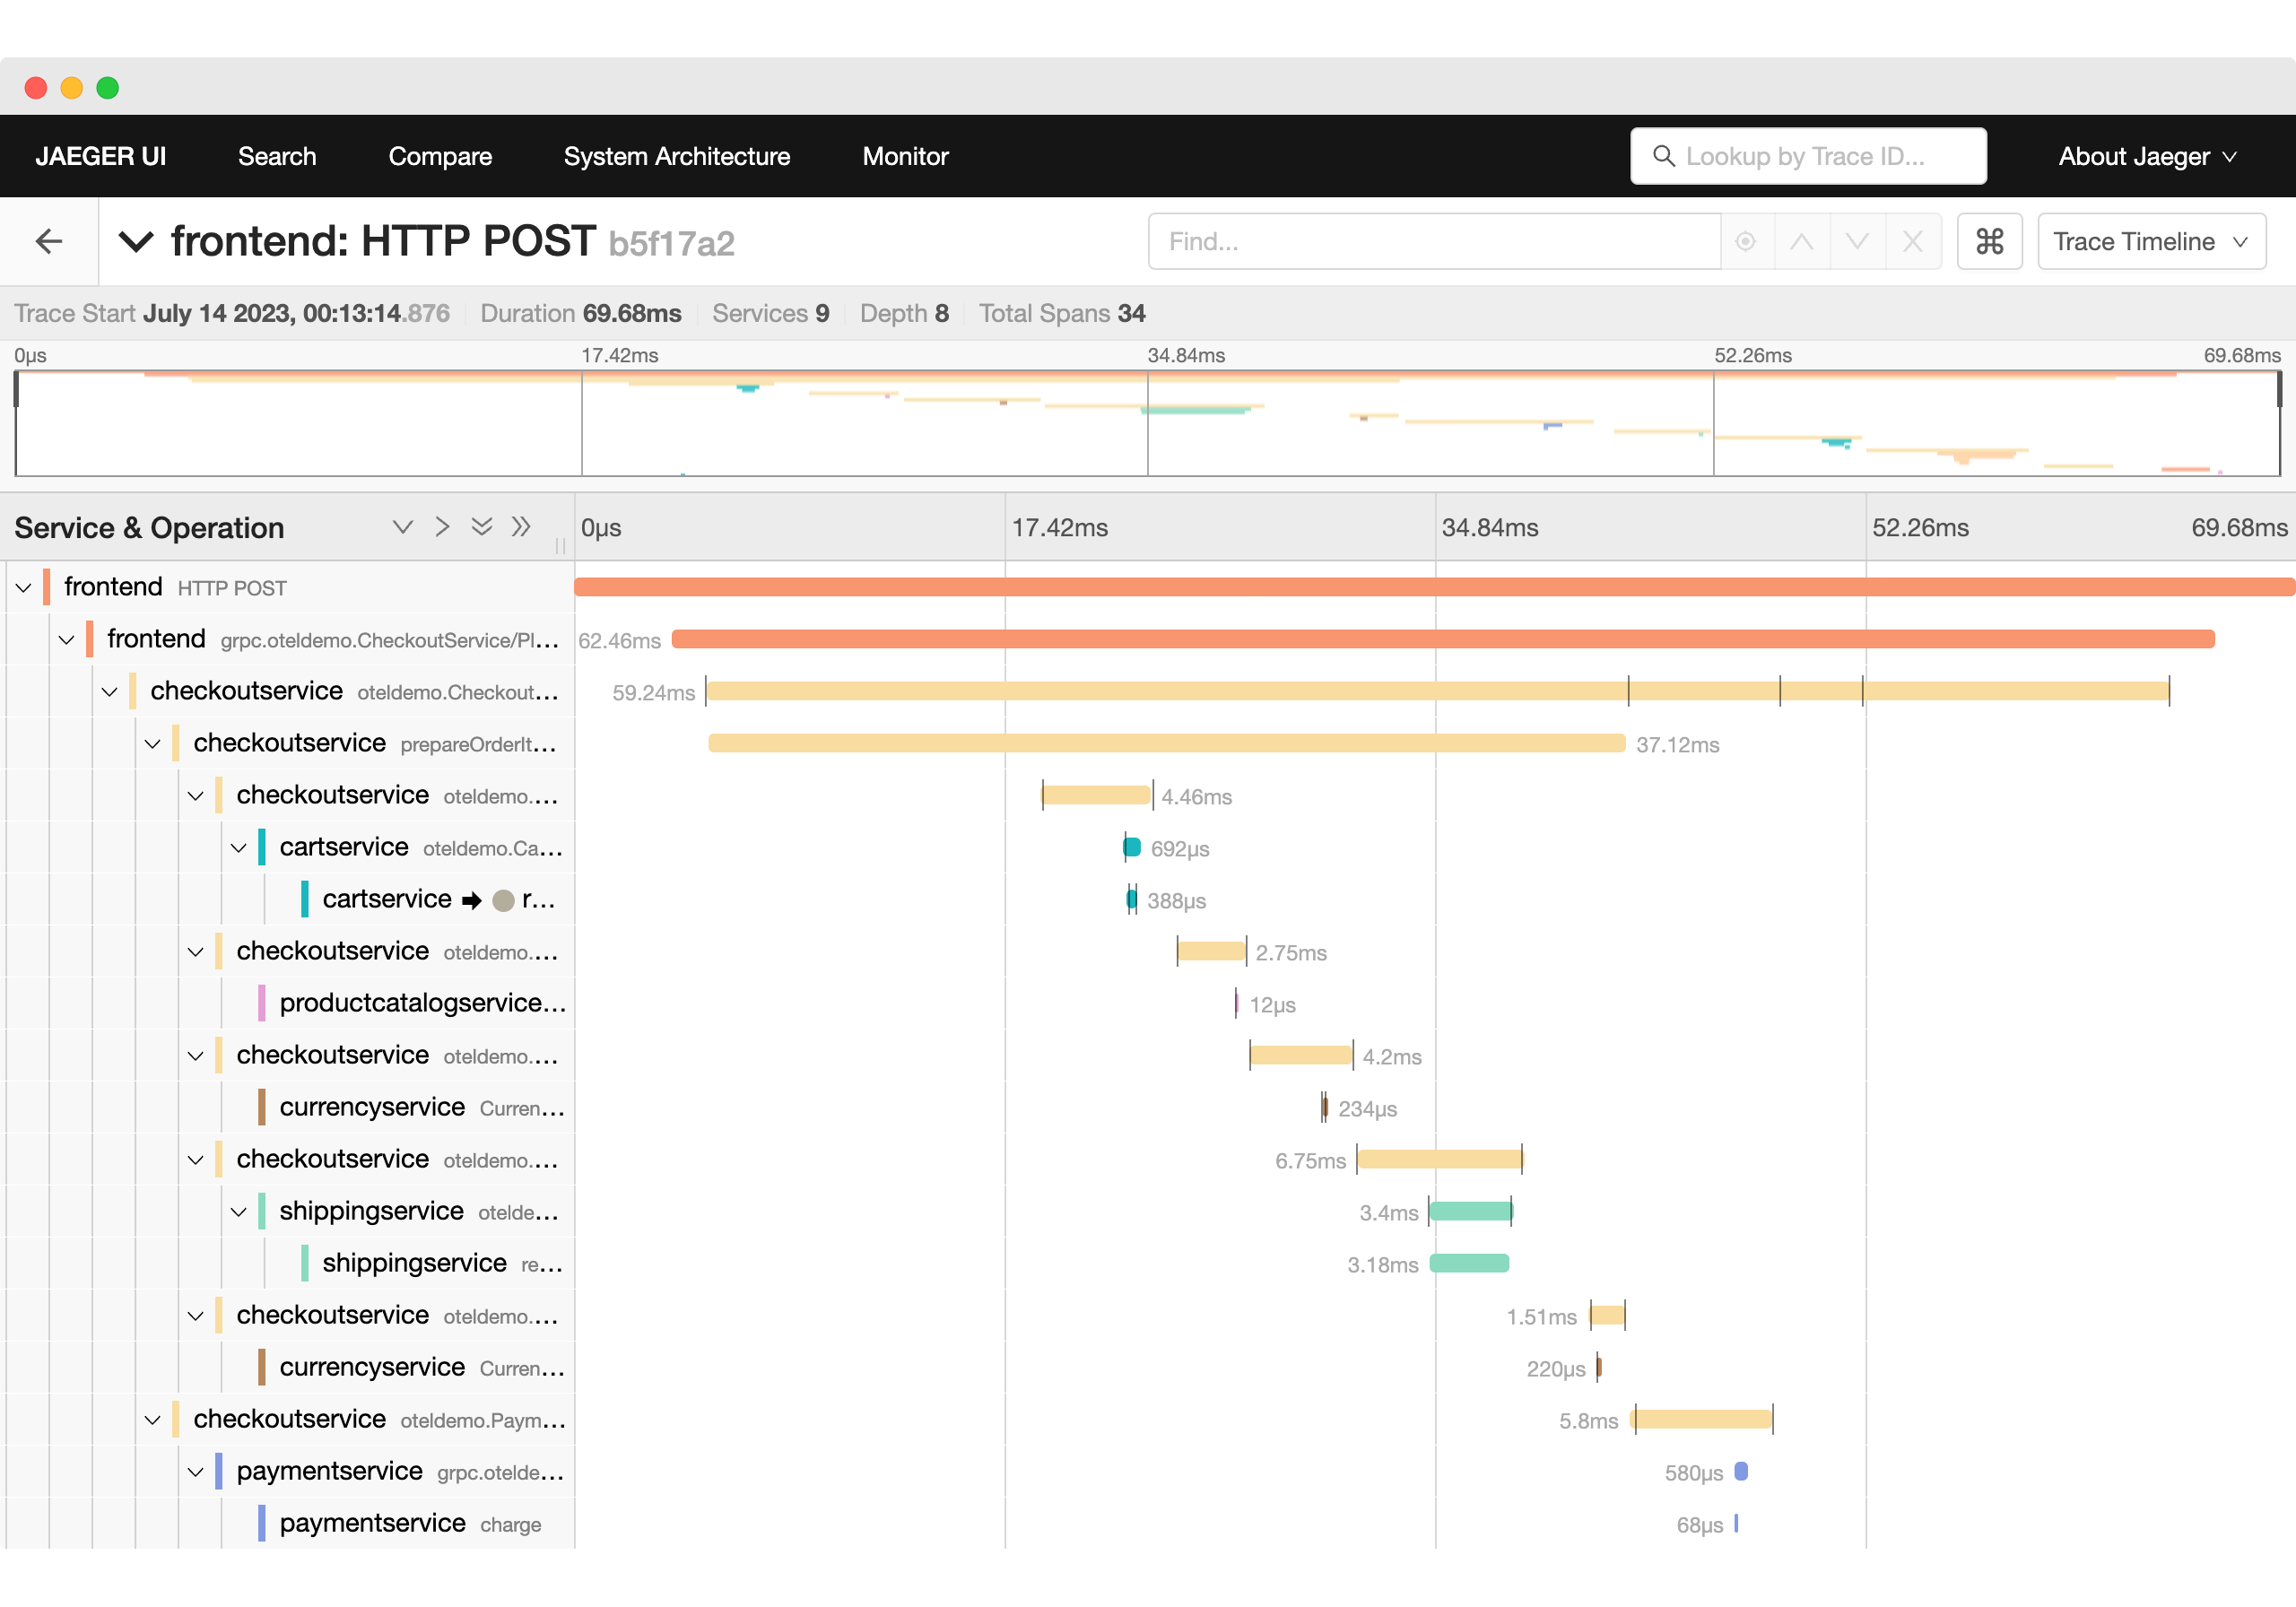
In this operation, we can see inner calls to multiple services, like Frontend, CheckoutService, CartService, ProductCatalogService, CurrencyService, and others.
This is a good scenario for a trace-based test where we can check if the output is correct and the services called in this process are working correctly together. We developed five groups of assertions, checking the main features triggered during the checkout:
- “The frontend has been called with success”, checking the output of the test trigger;
- “The order was placed”, checking if the CheckoutService was called and emitted spans correctly;
- “The user was charged”, checking if the PaymentService was called and emitted spans correctly;
- “The product was shipped”, checking if the ShippingService was called and emitted spans correctly;
- “The cart was emptied”, checking if the CartService was called and emitted spans correctly.
The final result was the following test YAML, which triggers the Checkout operation and validates these five groups of assertions:
type: Test
spec:
  name: 'Frontend: Checking out shopping cart'
  description: Simulate user checking out shopping cart
  trigger:
    type: http
    httpRequest:
      url: http://{{frontend address}}/api/checkout
      method: POST
      headers:
        - key: Content-Type
          value: application/json
      body: |
        {
          "userId": "2491f868-88f1-4345-8836-d5d8511a9f83",
          "email": "someone@example.com",
          "address": {
            "streetAddress": "1600 Amphitheatre Parkway",
            "state": "CA",
            "country": "United States",
            "city": "Mountain View",
            "zipCode": "94043"
          },
          "userCurrency": "USD",
          "creditCard": {
            "creditCardCvv": 672,
            "creditCardExpirationMonth": 1,
            "creditCardExpirationYear": 2030,
            "creditCardNumber": "4432-8015-6152-0454"
          }
        }
  specs:
    - name: 'The frontend has been called with success'
      selector: span[name="Test trigger"]
      assertions:
        - attr:response.status = 200
    - selector:
        span[name="oteldemo.CheckoutService/PlaceOrder" rpc.system="grpc"
        rpc.method="PlaceOrder" rpc.service="oteldemo.CheckoutService"]
      name: 'The order was placed'
      assertions:
        - attr:app.user.id = "2491f868-88f1-4345-8836-d5d8511a9f83"
        - attr:app.order.items.count = 1
    - selector:
        span[name="oteldemo.PaymentService/Charge" rpc.system="grpc"
        rpc.method="Charge" rpc.service="oteldemo.PaymentService"]
      name: 'The user was charged'
      assertions:
        - attr:rpc.grpc.status_code  =  0
        - attr:selected_spans.count >= 1
    - selector:
        span[name="oteldemo.ShippingService/ShipOrder" rpc.system="grpc"
        rpc.method="ShipOrder" rpc.service="oteldemo.ShippingService"]
      name: 'The product was shipped'
      assertions:
        - attr:rpc.grpc.status_code = 0
        - attr:selected_spans.count >= 1
    - selector:
        span[name="oteldemo.CartService/EmptyCart" rpc.system="grpc"
        rpc.method="EmptyCart" rpc.service="oteldemo.CartService"]
      name: 'The cart was emptied'
      assertions:
        - attr:rpc.grpc.status_code = 0
        - attr:selected_spans.count >= 1
Finally, when running these tests we have the following report, showing each test file run in the transaction and also with the “Checkout” step described above:
✔  Frontend Service (http://tracetest-server:11633/transaction/frontend-all/run/1)
  ✔  Frontend: See Ads (http://tracetest-server: 11633/test/frontend-see-adds/run/1/test)
    ✔  It called the frontend with success and got a valid redirectUrl for each ads
    ✔  It returns two ads
  ✔  Frontend: Get recommendations (http://tracetest-server: 11633/test/frontend-get-recommendation/run/1/test)
    ✔  It called the frontend with success
    ✔  It called ListRecommendations correctly and got 5 products
  ✔  Frontend: Browse products (http://tracetest-server:11633/test/frontend-browse-product/run/1/test)
    ✔  It called the frontend with success and got a product with valid attributes
    ✔  It queried the product catalog correctly for a specific product
  ✔  Frontend: Add product to the cart (http://tracetest-server:11633/test/frontend-add-product/run/1/test)
    ✔  It called the frontend with success
    ✔  It added an item correctly into the shopping cart
    ✔  It set the cart item correctly on the database
  ✔  Frontend: View cart (http://tracetest-server:11633/test/frontend-view-cart/run/1/test)
    ✔  It called the frontend with success
    ✔  It retrieved the cart items correctly
  ✔  Frontend: Checking out shopping cart (http://tracetest-server: 11633/test/frontend-checkout-shopping-cart/run/1/test)
    ✔  It called the frontend with success
    ✔  The order was placed
    ✔  The user was charged
    ✔  The product was shipped
    ✔  The cart was emptied
Running the tests and evaluating the OpenTelemetry Demo
With the completed test suite, run it by executing make run-tracetesting in
the demo. This will evaluate all services in the OpenTelemetry Demo.
During the development of the tests, we noticed some differences in the test results. For example, some minor fixes were made to the Cypress tests, and some behaviors were observed in the backend APIs that can be tested and investigated at a later time. You can find the details in this pull request and this discussion.
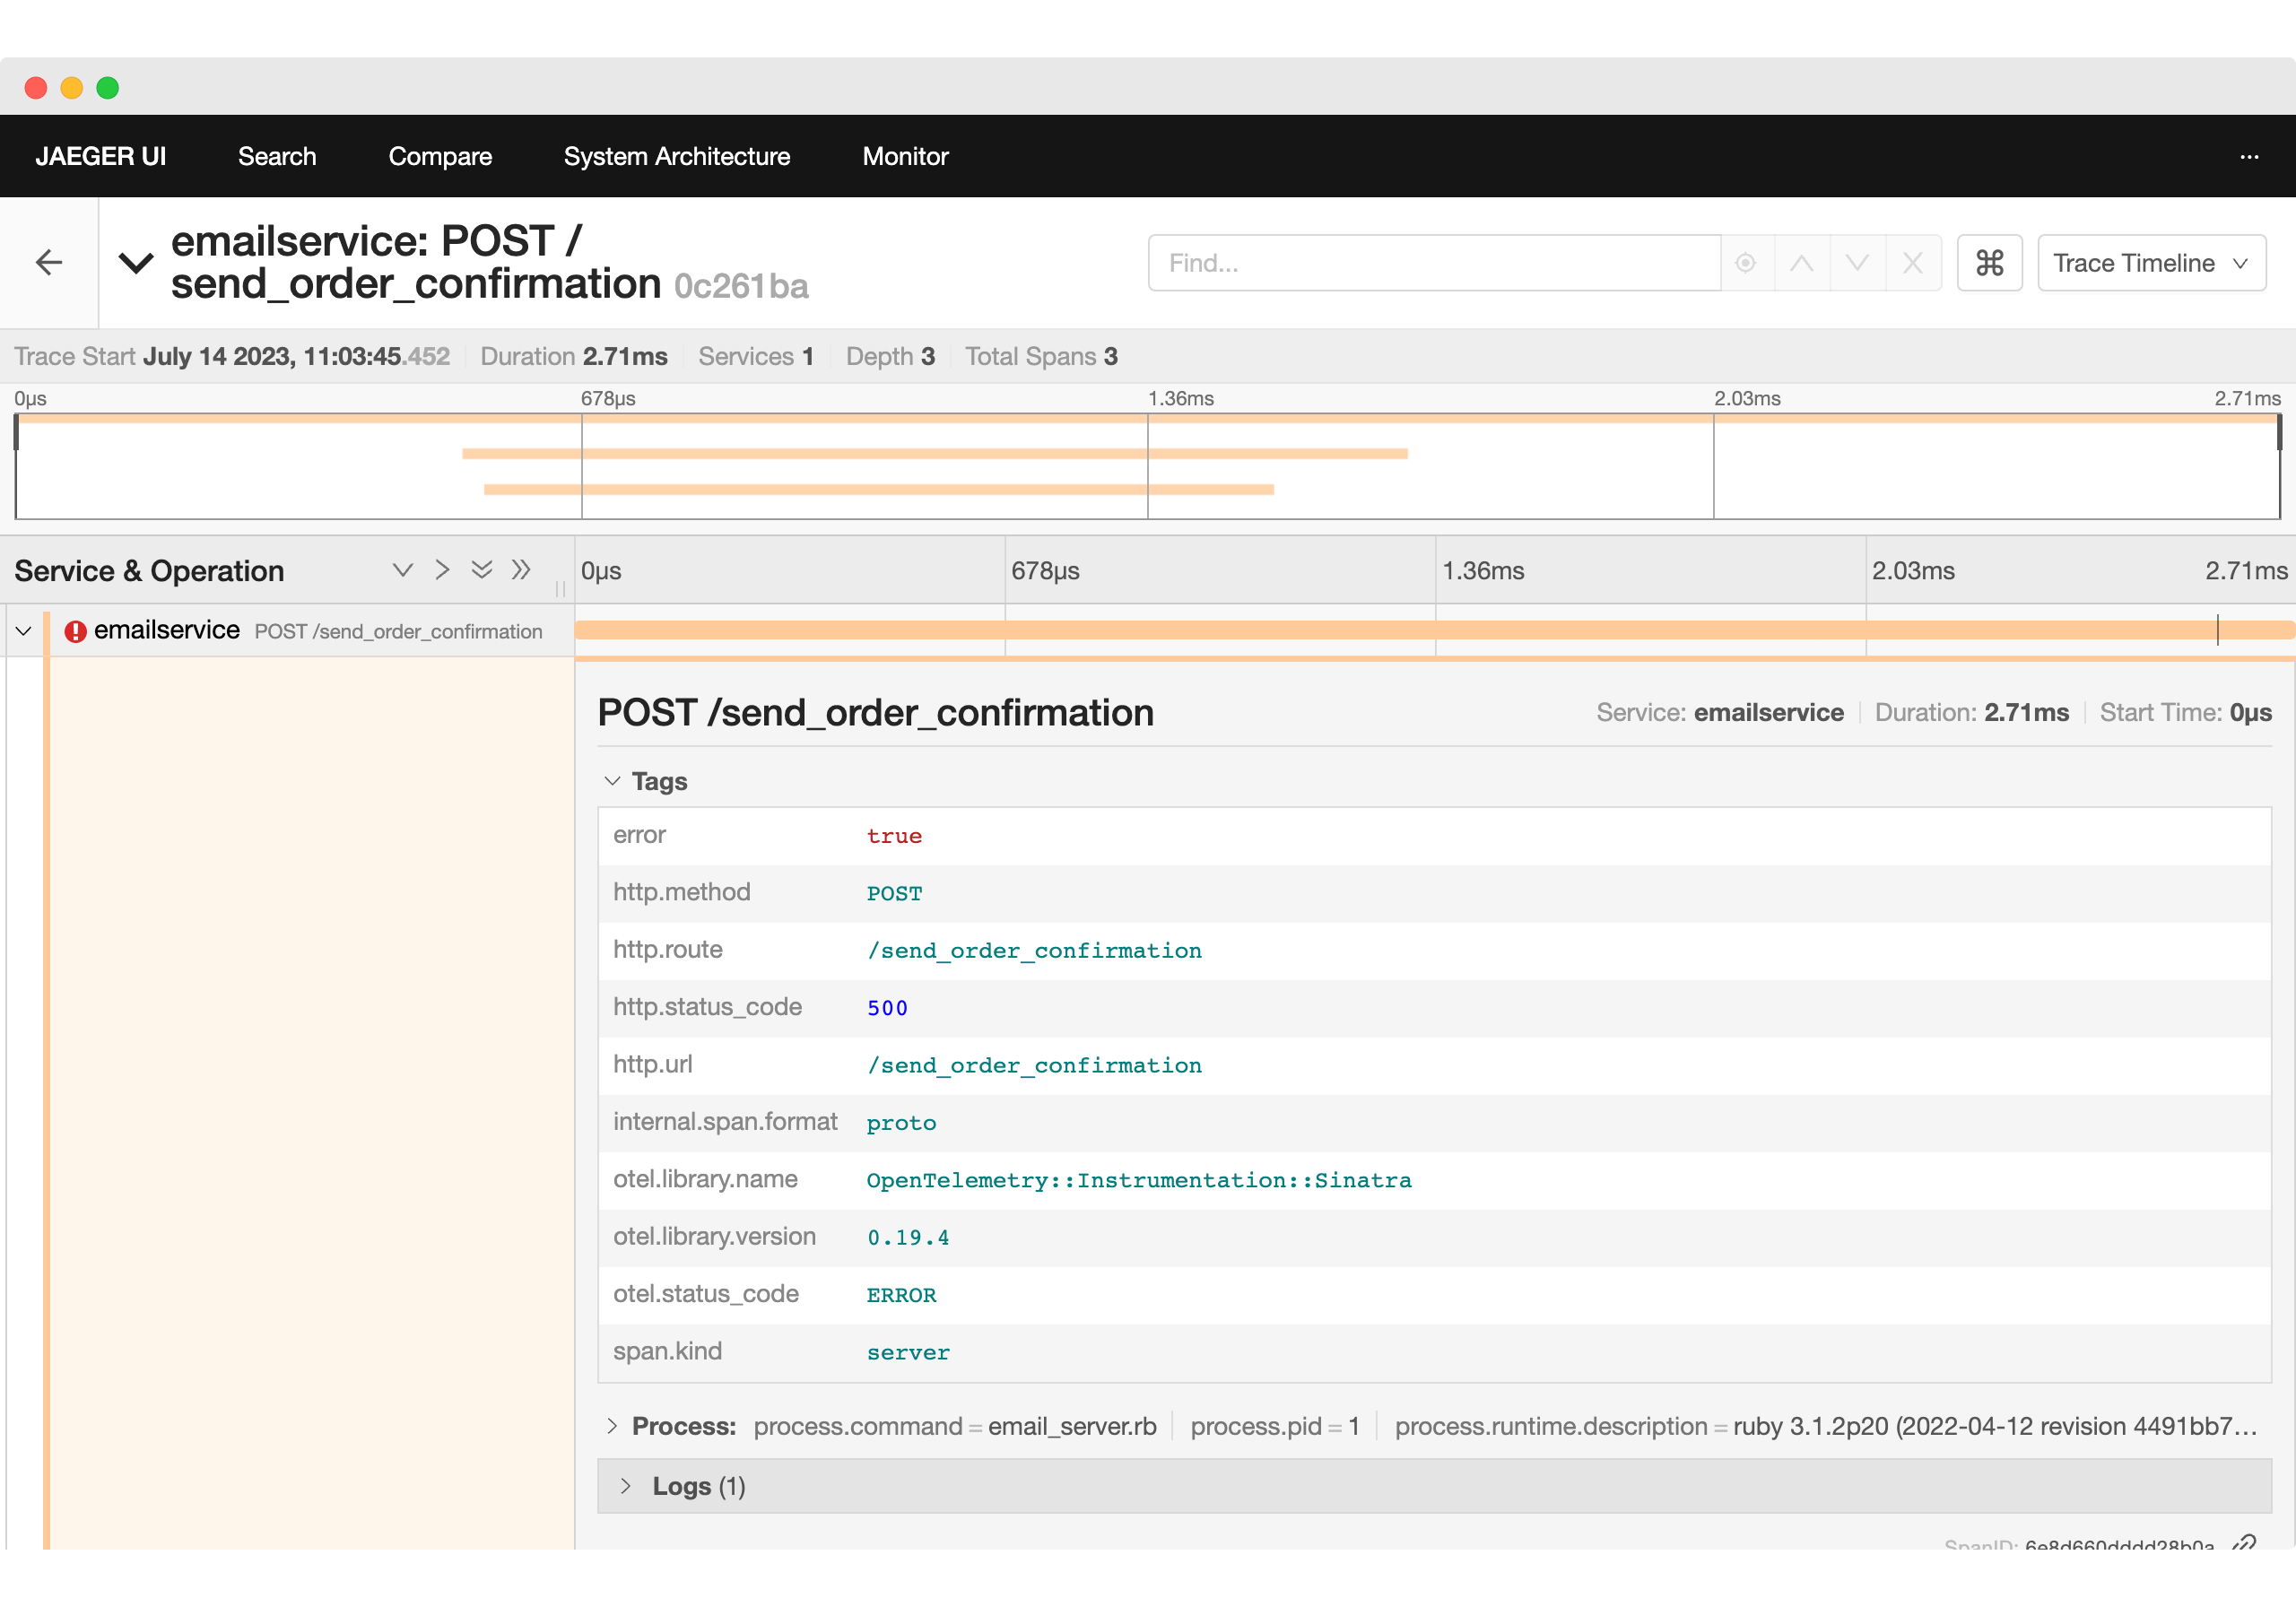
One curious case was the behavior of the
EmailService.
When building tests for the first time and calling it directly with the payload
provided by AVA tests, traces were generated for the service indicating success,
but with an HTTP 500 error, as can be seen in Jaeger.
However, running it as part of the checkout process it executed as expected, as shown in this Jaeger screenshot:
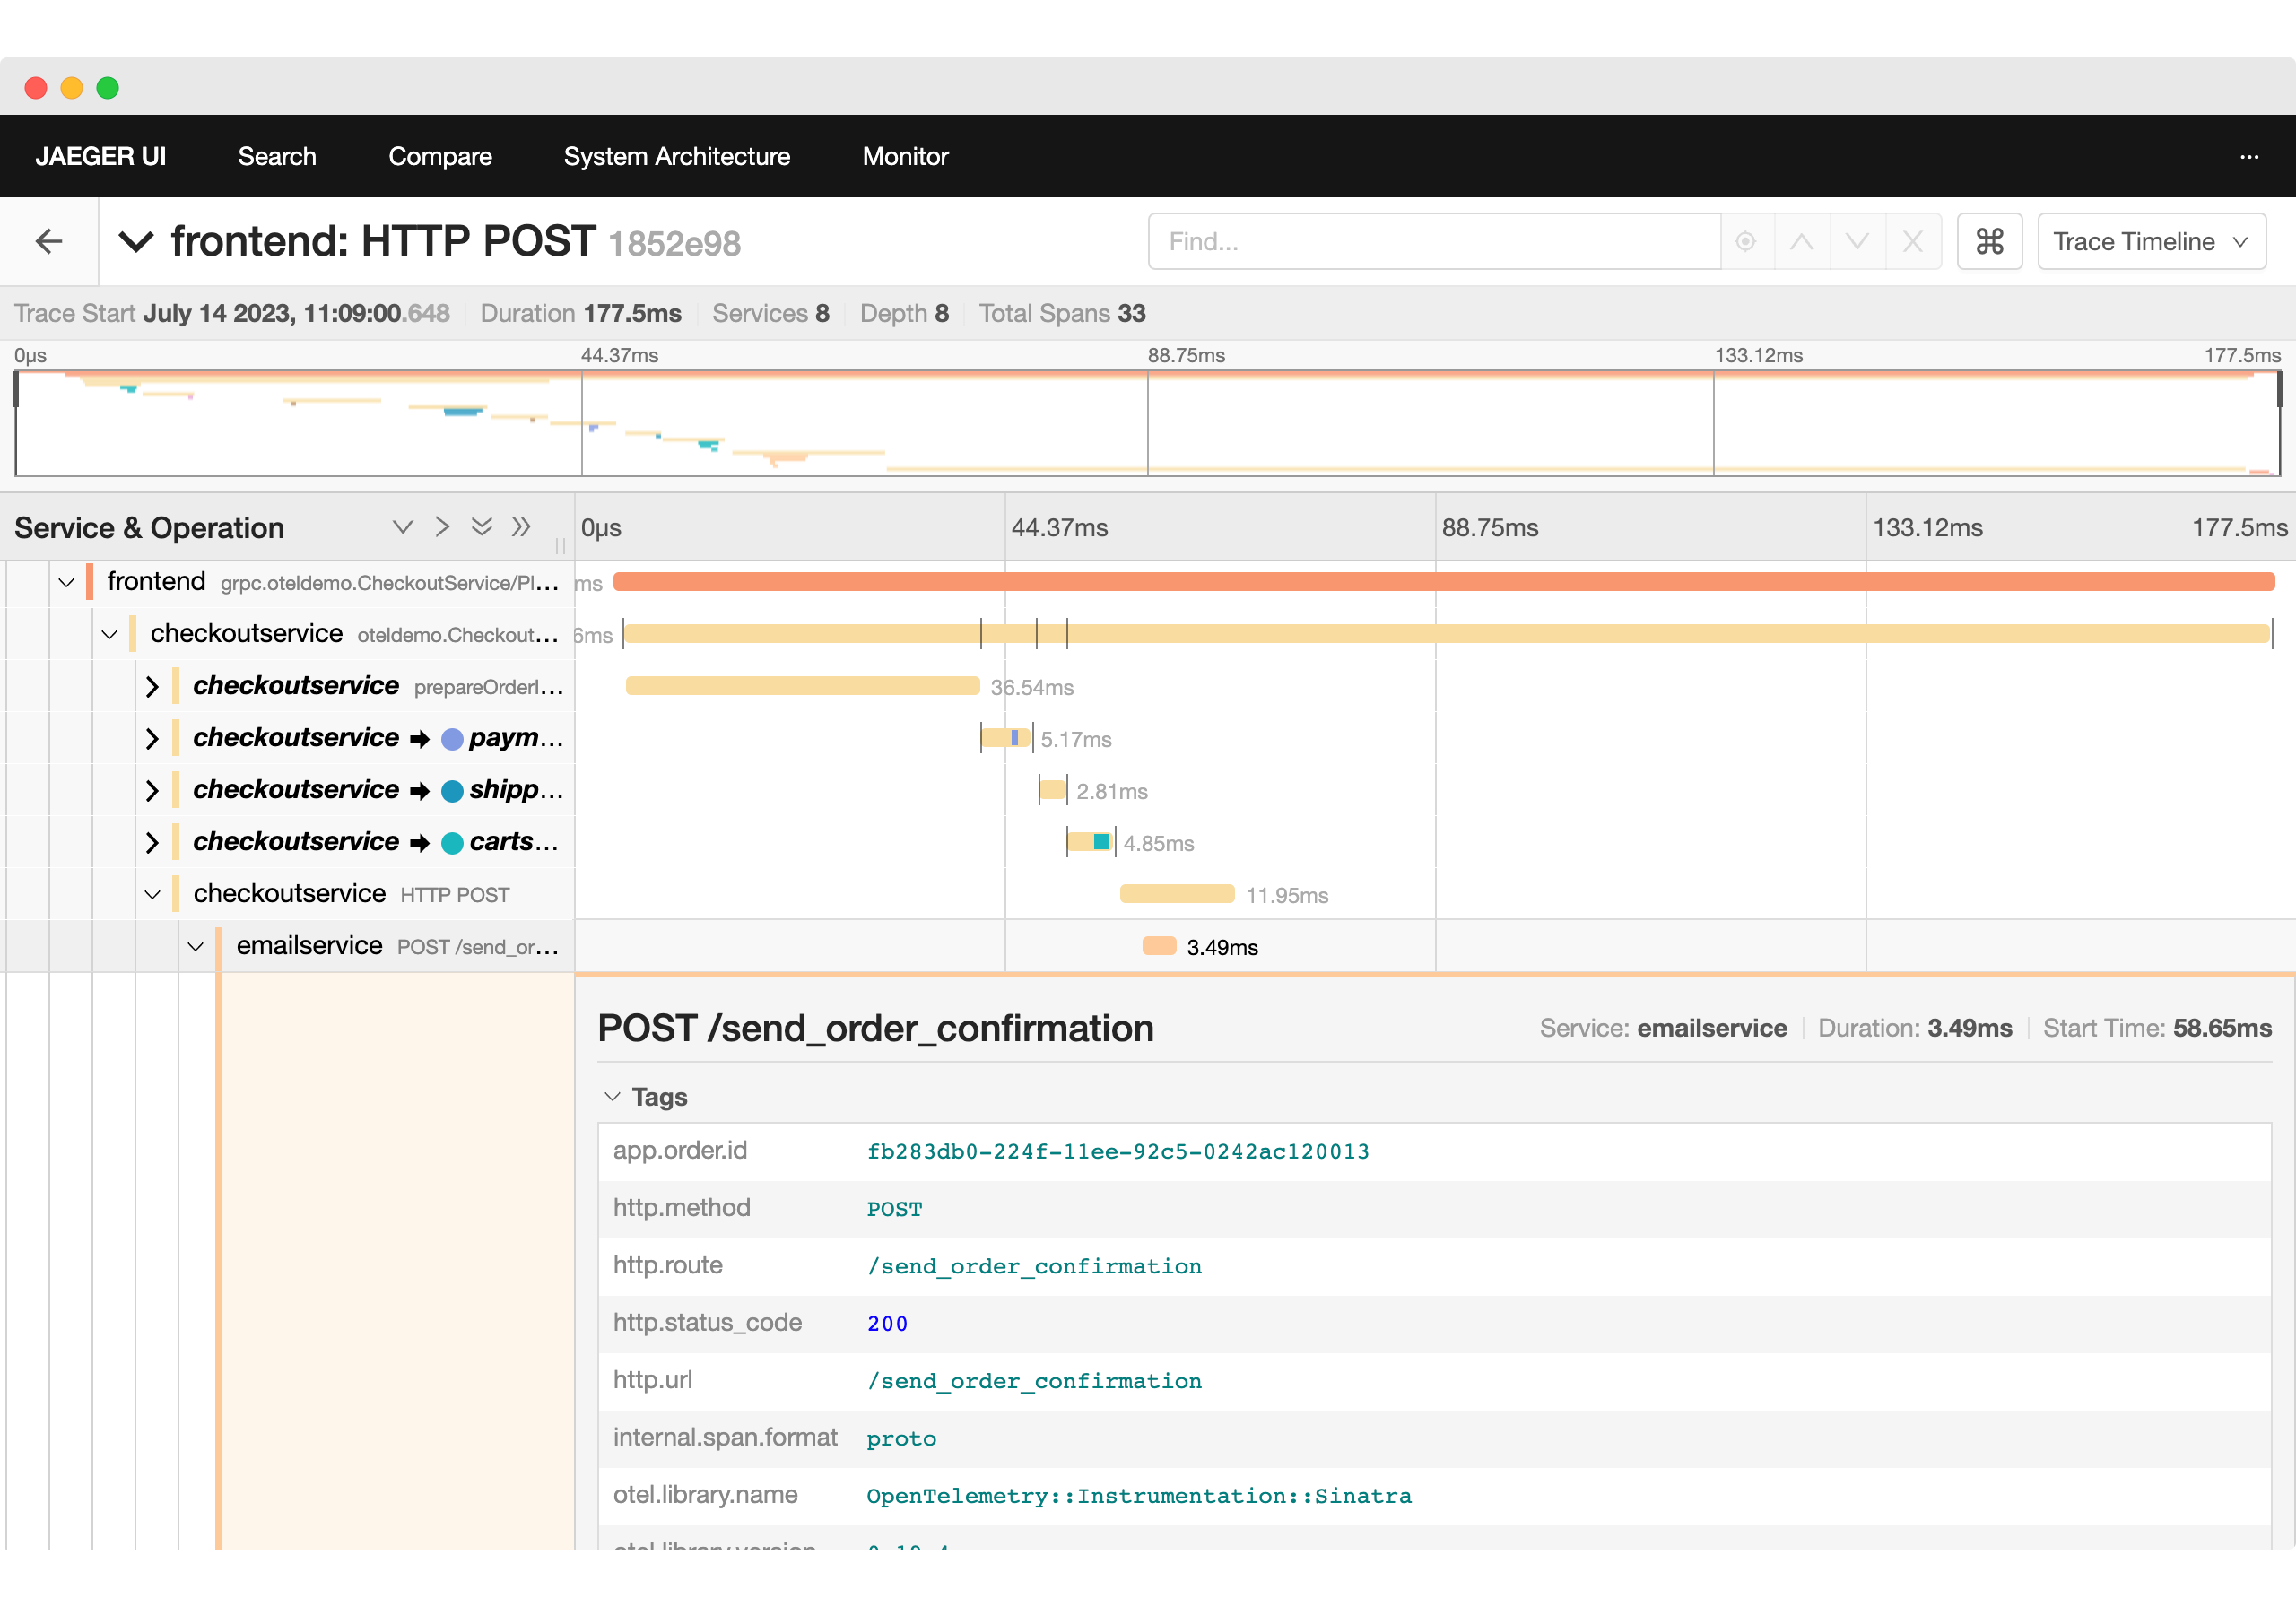
What could have happened? By looking deeper at the telemetry and the code, we
found out that due to the nature of handling email templates on the Email
service, written in Ruby using the snake_case standard, instead of sending the
order details as pascalCase in JSON:
{
  "email": "google@example.com",
  "order": {
    "orderId": "505",
    "shippingCost": {
      "currencyCode": "USD"
    }
    // ...
  }
}
We should pass them as snake_case, which the Checkout service does correctly:
{
  "email": "google@example.com",
  "order": {
    "order_id": "505",
    "shipping_cost": {
      "currency_code": "USD"
    }
    // ...
  }
}
By doing that, we have a successful call to the service, and it evaluates correctly as seen here:
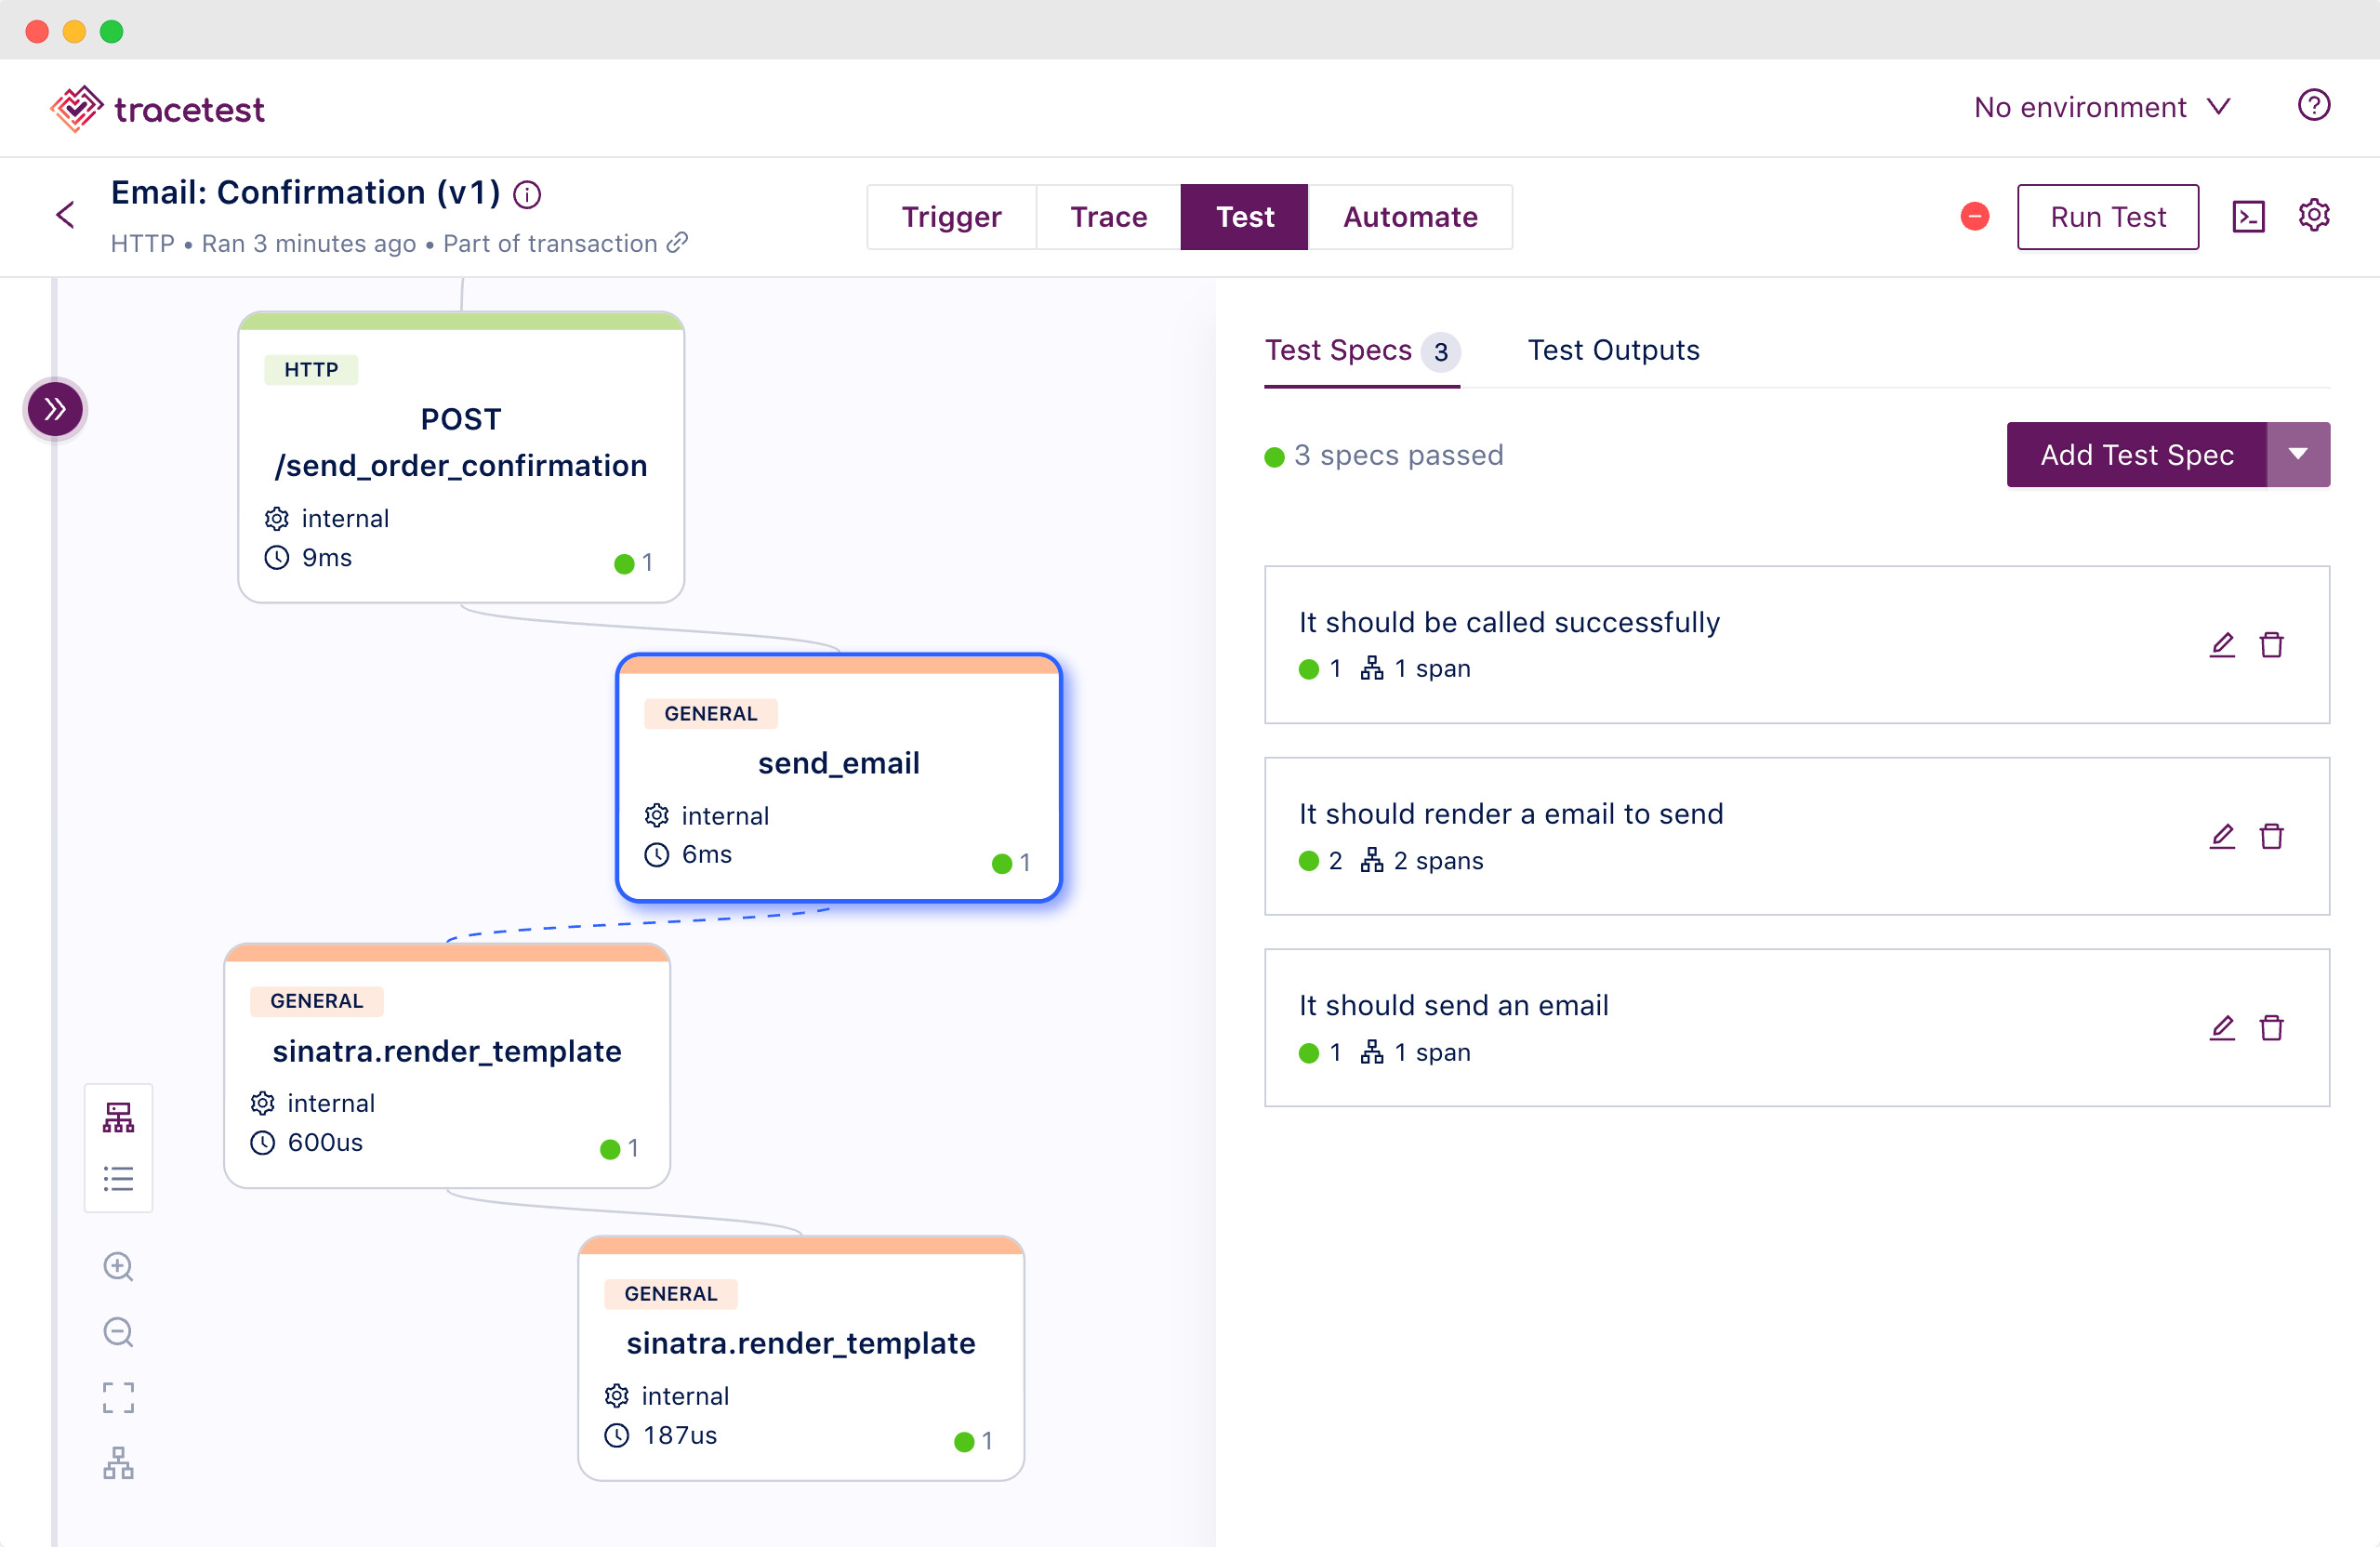
This type of case is interesting because it could happen in other real-world scenarios, and with the help of the tests and telemetry data, we were able to pinpoint and solve it. In the case of this test, we opted out of using the same pattern as the Checkout service.
Conclusion
This article discussed how trace-based tests were added to the OpenTelemetry Demo to help ensure that changes to the system did not have unwanted outcomes on the micro-services results and their telemetry.
With these tests, the OpenTelemetry community can add new features to the demo, have an easy way to validate if other components did not suffer any unwanted side effects, and still report telemetry correctly.
As a team building an open source observability tool, we value the opportunity to contribute to the overall OpenTelemetry community. That’s why we took action on the issue as soon as it was opened two months ago.