Portable Synthetic HTTP Testing with OpenTelemetry
Synthetic tests are an essential part of the Observability toolkit. They can be used to measure application SLAs, monitor endpoints in various geographies, navigate a web page like a user, or identify post deployment errors before your customers encounter them.
This blog is going to focus on HTTP based synthetic availability testing. Many vendors offer various options for availability testing with generous free tiers but monitoring endpoints at enterprise scale can quickly spiral into 1000s of tests that can’t be easily transferred when migrating Observability vendors. OpenTelemetry (OTel) is committed to the portability of Observability data to help users maximize their visibility into their services and get the most out of their Observability investments without the need to continually recreate the same capabilities.
The community is continually improving the project’s capabilities and it can be easy to miss new features. In the v0.63.0 release, the OTel Collector added support for synthetic HTTP checks via a receiver called the HTTP Check Receiver. This component sends a request via HTTP or HTTPS and produces metrics to capture the duration of the request and record the returned status code. You can now deploy an agent to your preferred environment to test public OR private endpoints without the need to whitelist IPs in your firewall and transfer the tests between your preferred destination like any other piece of OTel data.
Deploy your first OTel Synthetic ping test(s)
Getting started with OTel synthetics is simple. You configure your Collector like usual and add the HTTP Check receiver with your chosen endpoints, HTTP verb, and collection interval. Here’s a basic Collector configuration to get you started. Sending a request body is not supported yet but you can still send custom headers in the various requests.
receivers:
  httpcheck:
    targets:
      - endpoint: https://api.restful-api.dev/objects
        method: GET
      - endpoint: https://httpbin.org/delete
        method: DELETE
      - endpoint: https://httpbin.org/post
        method: POST
        headers:
          test-key: 'test-123'
    collection_interval: 10s

exporters:
  #Your chosen exporter

processors:
  batch:

service:
  pipelines:
    metrics:
      receivers: [httpcheck]
      processors: [batch]
      #exporters: [your-exporter]
Synthetic Test Output
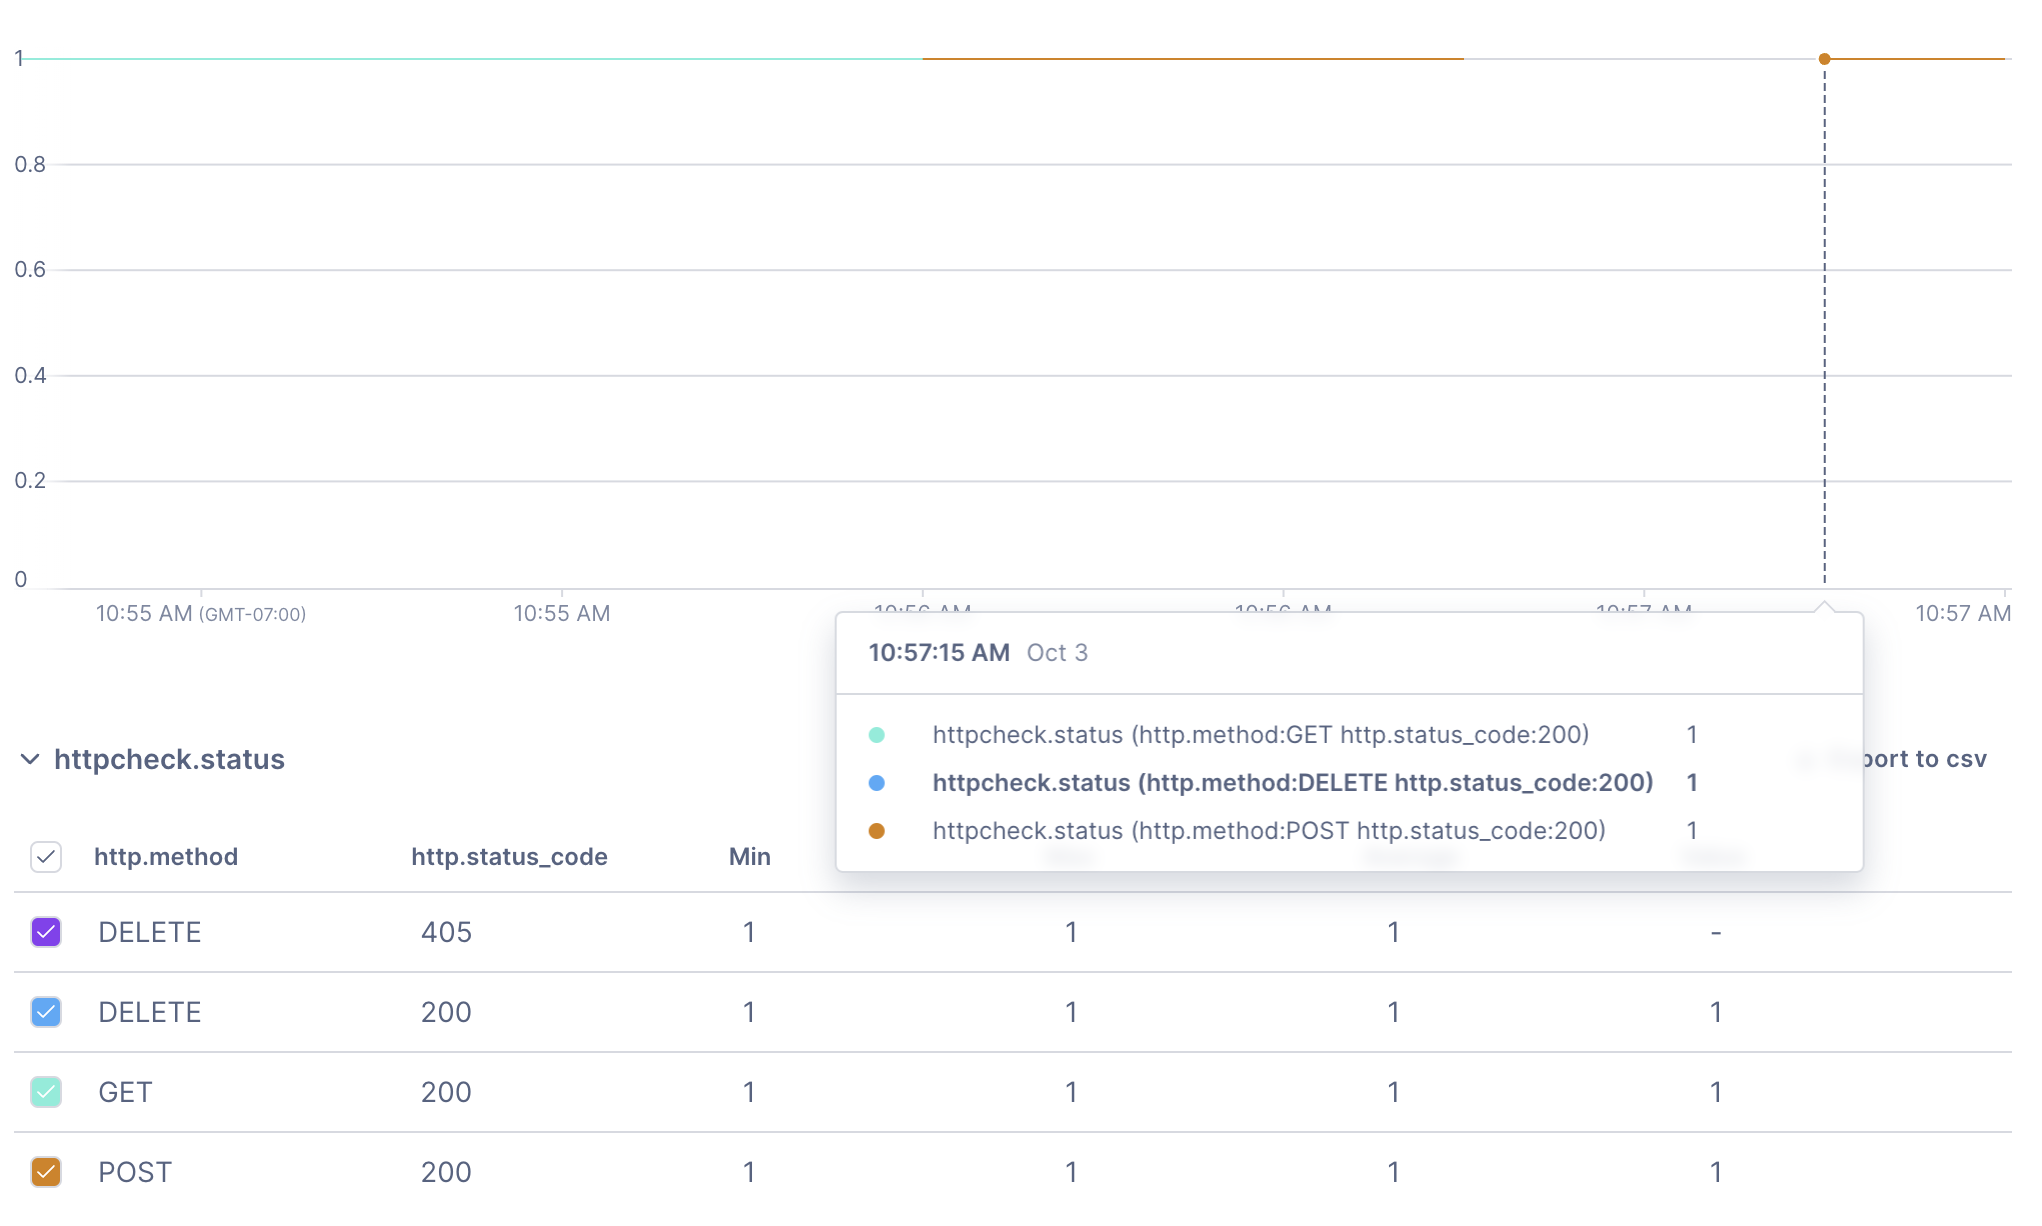
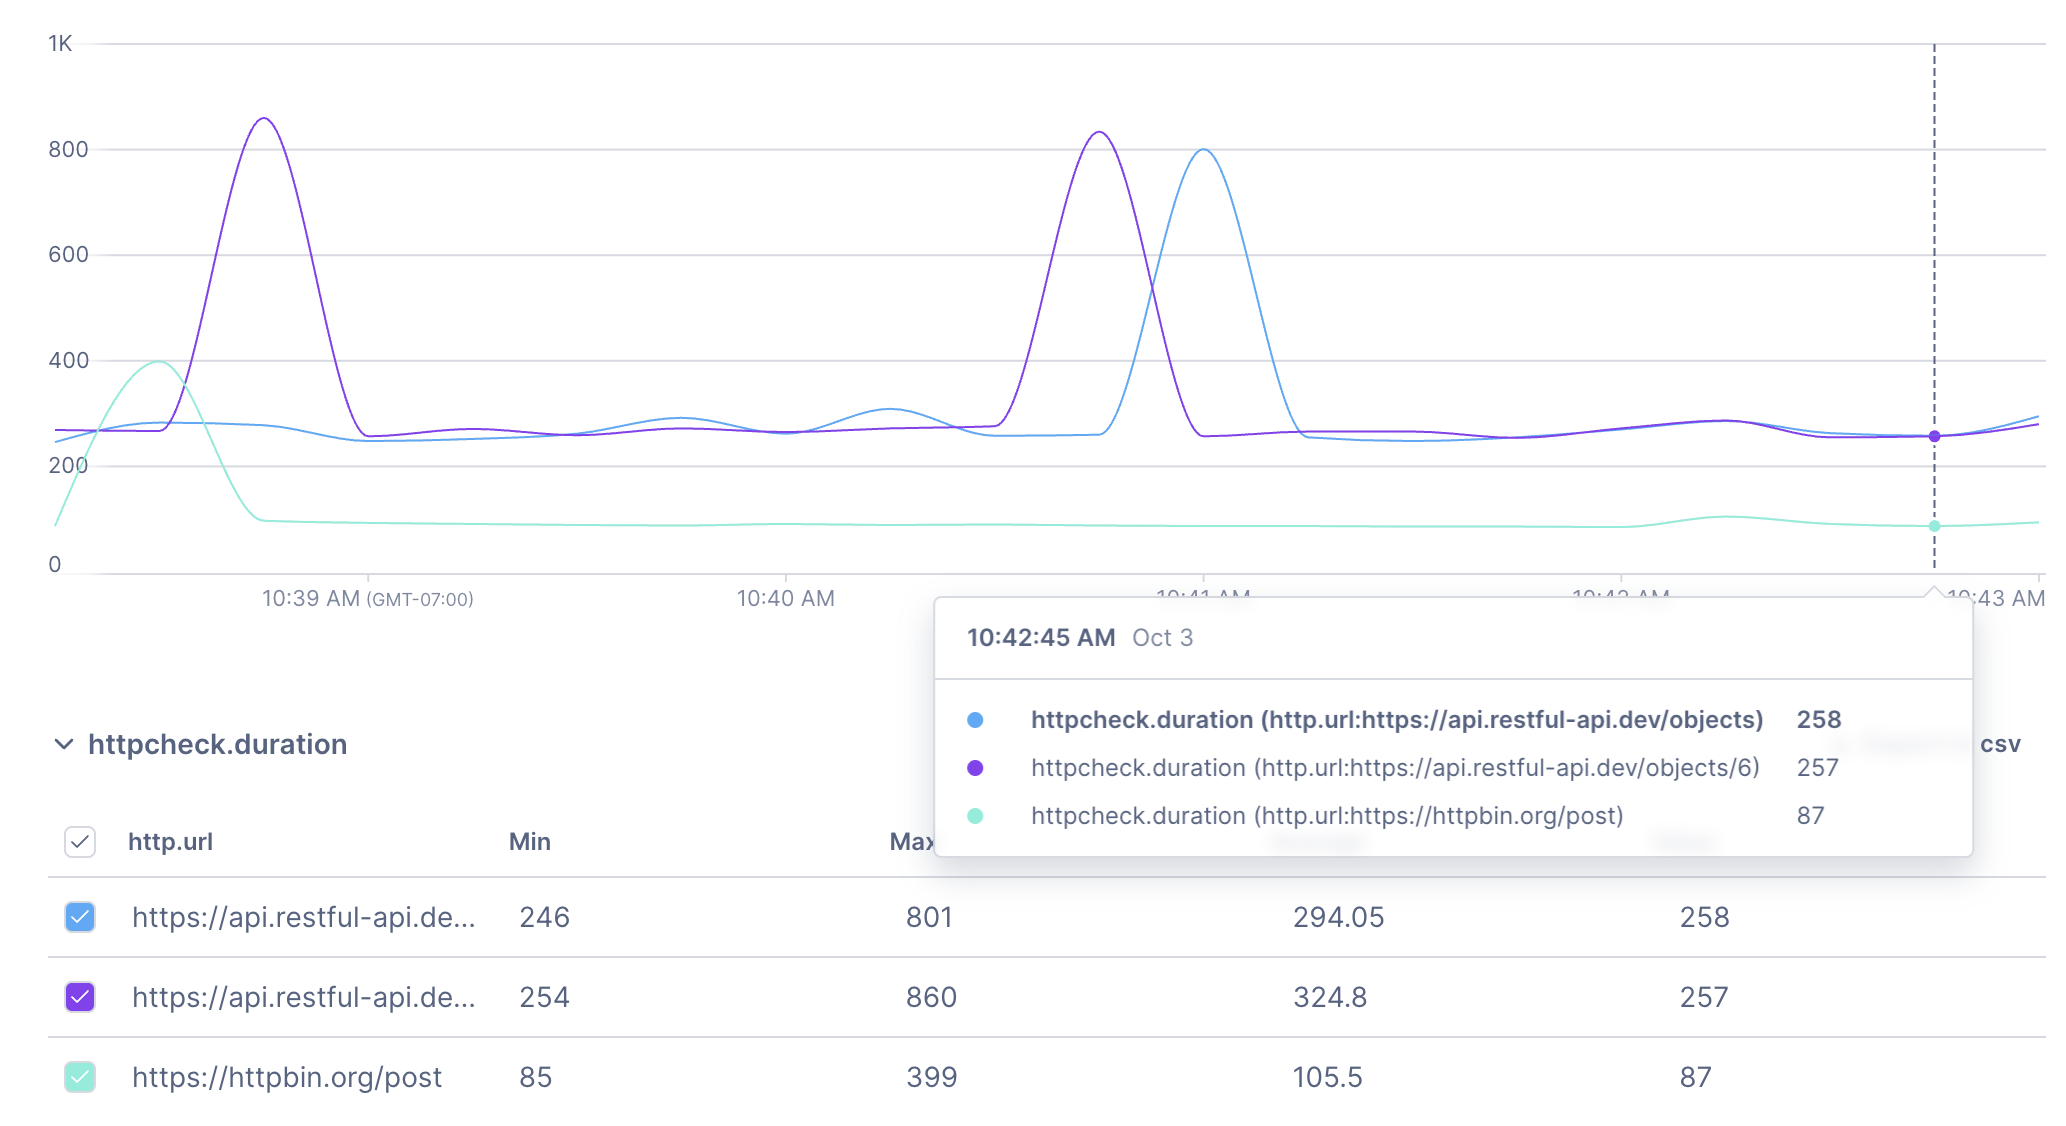
The receiver generates 3 metrics by default: httpcheck.duration
httpcheck.status and httpcheck.error. The metrics can be used in
visualizations or to define alerts. If no errors occur then the
httpcheck.error chart won’t be populated. Here are some example screenshots
from the httpcheck.duration and httpcheck.status metrics.
Duration Check

Status Check

What’s Next?
Synthetic testing is an exciting new capability for OTel that the community hopes to evolve over time. If you have any specific requests around new Synthetic capabilities feel free to open an issue in the opentelemetry-collector-contrib repository for the HTTP Check receiver or open a PR and add the capabilities yourself. All contributions and feedback are welcome and appreciated.
For more complex browser based tests the Selenium project has a native OpenTelemetry integration available. I’m hoping to write a follow up blog on how to leverage this data.
In the future I’d like to see us add support for custom request bodies or ingesting results from other complex browser test frameworks like Playwright. Happy testing!